Search for Indicators
Disparities Dashboard
Health inequities are unfair, unjust, and avoidable differences in health status of groups of people. This dashboard shows all the indicators that are able to be broken down by race/ethnicity, age, and gender, and highlights inequities that exist in Washtenaw County. Additional inequities exist beyond what is highlighted on this list. Many of the indicators on this site include zip code level data that can show geographic inequities. You can see this data by clicking on an individual data indicator.
For additional data on inequities in Washtenaw County, visit the Opportunity Index. The Opportunity Index is a tool that illustrates where there is and isn’t access to opportunity across Washtenaw County.
Washtenaw County Health Department envisions a healthy community where every resident has the opportunity to achieve optimal health and well-being. The Health Department strives to apply a health equity lens to all our work.
Indicator Gauge Icon Legend
Legend Colors
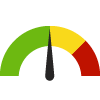
Red is bad, green is good, blue is not statistically different/neutral.
Compared to Distribution
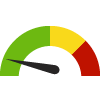 the value is in the best half of communities.
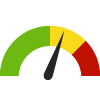 the value is in the 2nd worst quarter of communities.
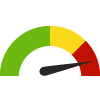 the value is in the worst quarter of communities.
Compared to Target
 meets target;
  does not meet target.
Compared to a Single Value
 lower than the comparison value;
 higher than the comparison value;
 not statistically different from comparison value.
Trend

 non-significant change over time;
 significant change over time;
  no change over time.
Compared to Prior Value
 higher than the previous measurement period;
 lower than the previous measurement period;
 no statistically different change from previous measurement period.
 Significantly better than the overall value
 Significantly worse than the overall value
 Significantly different than the overall value
 No significant difference with the overall value
 No data on significance available
County: Washtenaw
Health / Alcohol & Drug Use
Value
Compared to:
County: Washtenaw Age-Adjusted Drug and Opioid-Involved Overdose Death Rate
County: Washtenaw Age-Adjusted Drug and Opioid-Involved Overdose Death Rate
21.2
Deaths per 100,000 population
(2018-2020)
Compared to:
MI Counties
The distribution is based on data from 44 Michigan counties.
U.S. Counties
The distribution is based on data from 1,303 U.S. counties and county equivalents.
MI Value
(26.5)
The regional value is compared to the Michigan State value.
US Value
(23.5)
The regional value is compared to the national value.
Prior Value
(21.2)
Prior Value compares a measured value with the previously measured value. Confidence intervals were taken into account in determining the direction of the comparison.
County: Washtenaw Death Rate due to Drug Poisoning
County: Washtenaw Death Rate due to Drug Poisoning
20.4
Deaths per 100,000 population
(2019-2021)
Compared to:
MI Counties
The distribution is based on data from 60 Michigan counties.
U.S. Counties
The distribution is based on data from 1,899 U.S. counties and county equivalents.
MI Value
(27.4)
The regional value is compared to the Michigan State value.
US Value
(27.2)
The regional value is compared to the national value.
HP 2030 Target
(20.7)
<div>SU-03: Reduce drug overdose deaths <strong>(LEADING HEALTH INDICATOR)</strong></div>
County: Washtenaw Misuse of Drugs
County: Washtenaw Misuse of Drugs
5.1%
% of adults
(2015)
Compared to:
Prior Value
(7.4%)
Prior Value compares a measured value with the previously measured value. Confidence intervals were not taken into account in determining the direction of the comparison.
County: Washtenaw Teens who Binge Drink: 9th, 11th Graders
County: Washtenaw Teens who Binge Drink: 9th, 11th Graders
6.0%
(2022)
Compared to:
MI Value
(11.2% in 2020)
The regional value is compared to the 2019 Michigan state value for 9th - 12th graders.
Prior Value
(9.6%)
Prior Value compares a measured value with the previously measured value. Confidence intervals were not taken into account in determining the direction of the comparison.
Trend
This comparison measures the indicator’s values over multiple time periods.<br>The Mann-Kendall Test for Statistical Significance is used to evaluate the trend<br>over 4 to 10 periods of measure, subject to data availability and comparability.
10.8%
(2022)
Compared to:
MI Value
(25.4% in 2020)
The regional value is compared to the 2019 Michigan state value for 9th - 12th graders.
Prior Value
(14.9%)
Prior Value compares a measured value with the previously measured value. Confidence intervals were not taken into account in determining the direction of the comparison.
Trend
This comparison measures the indicator’s values over multiple time periods.<br>The Mann-Kendall Test for Statistical Significance is used to evaluate the trend<br>over 4 to 10 periods of measure, subject to data availability and comparability.
County: Washtenaw Teens who Use Marijuana: 9th, 11th Graders
County: Washtenaw Teens who Use Marijuana: 9th, 11th Graders
7.8%
(2022)
Compared to:
MI Value
(21.6% in 2020)
The regional value is compared to the 2019 Michigan state value for 9th - 12th graders.
Prior Value
(14.0%)
Prior Value compares a measured value with the previously measured value. Confidence intervals were not taken into account in determining the direction of the comparison.
Trend
This comparison measures the indicator’s values over multiple time periods.<br>The Mann-Kendall Test for Statistical Significance is used to evaluate the trend<br>over 4 to 10 periods of measure, subject to data availability and comparability.
County: Washtenaw
Health / Cancer
Value
Compared to:
County: Washtenaw Age-Adjusted Death Rate due to Breast Cancer
County: Washtenaw Age-Adjusted Death Rate due to Breast Cancer
21.5
Deaths per 100,000 females
(2016-2020)
Compared to:

MI Counties
The distribution is based on data from 61 Michigan counties.
U.S. Counties
The distribution is based on data from 1,755 U.S. counties and county equivalents.
MI Value
(20.2)
The regional value is compared to the Michigan State value.
US Value
(19.6)
The regional value is compared to the national value.
Prior Value
(20.7)
Prior Value compares a measured value with the previously measured value. Confidence intervals were taken into account in determining the direction of the comparison.
Trend
This comparison measures the indicator’s values over multiple time periods.<br>The Mann-Kendall Test for Statistical Significance is used to evaluate the trend<br>over 4 to 10 periods of measure, subject to data availability and comparability.
HP 2030 Target
(15.3)
County: Washtenaw Age-Adjusted Death Rate due to Cancer
County: Washtenaw Age-Adjusted Death Rate due to Cancer
139.9
Deaths per 100,000 population
(2016-2020)
Compared to:
MI Counties
The distribution is based on data from 83 Michigan counties.
U.S. Counties
The distribution is based on data from 3,085 U.S. counties and county equivalents.
MI Value
(160.6)
The regional value is compared to the Michigan State value.
US Value
(149.4)
The regional value is compared to the national value.
Prior Value
(139.8)
Prior Value compares a measured value with the previously measured value. Confidence intervals were taken into account in determining the direction of the comparison.
Trend
This comparison measures the indicator’s values over multiple time periods.<br>The Mann-Kendall Test for Statistical Significance is used to evaluate the trend<br>over 4 to 10 periods of measure, subject to data availability and comparability.
HP 2030 Target
(122.7)
County: Washtenaw Age-Adjusted Death Rate due to Colorectal Cancer
County: Washtenaw Age-Adjusted Death Rate due to Colorectal Cancer
11.5
Deaths per 100,000 population
(2016-2020)
Compared to:
MI Counties
The distribution is based on data from 71 Michigan counties.
U.S. Counties
The distribution is based on data from 2,174 U.S. counties and county equivalents.
MI Value
(13.4)
The regional value is compared to the Michigan State value.
US Value
(13.1)
The regional value is compared to the national value.
Prior Value
(11.0)
Prior Value compares a measured value with the previously measured value. Confidence intervals were taken into account in determining the direction of the comparison.
Trend
This comparison measures the indicator’s values over multiple time periods.<br>The Mann-Kendall Test for Statistical Significance is used to evaluate the trend<br>over 4 to 10 periods of measure, subject to data availability and comparability.
HP 2030 Target
(8.9)
County: Washtenaw Age-Adjusted Death Rate due to Lung Cancer
County: Washtenaw Age-Adjusted Death Rate due to Lung Cancer
29.8
Deaths per 100,000 population
(2016-2020)
Compared to:
MI Counties
The distribution is based on data from 82 Michigan counties.
U.S. Counties
The distribution is based on data from 2,752 U.S. counties and county equivalents.
MI Value
(40.6)
The regional value is compared to the Michigan State value.
US Value
(35.0)
The regional value is compared to the national value.
Prior Value
(30.7)
Prior Value compares a measured value with the previously measured value. Confidence intervals were taken into account in determining the direction of the comparison.
Trend
This comparison measures the indicator’s values over multiple time periods.<br>The Mann-Kendall Test for Statistical Significance is used to evaluate the trend<br>over 4 to 10 periods of measure, subject to data availability and comparability.
HP 2030 Target
(25.1)
County: Washtenaw Age-Adjusted Death Rate due to Prostate Cancer
County: Washtenaw Age-Adjusted Death Rate due to Prostate Cancer
18.3
Deaths per 100,000 males
(2016-2020)
Compared to:

U.S. Counties
The distribution is based on data from 1,576 U.S. counties and county equivalents.
MI Value
(18.6)
The regional value is compared to the Michigan State value.
US Value
(18.8)
The regional value is compared to the national value.
Prior Value
(19.0)
Prior Value compares a measured value with the previously measured value. Confidence intervals were taken into account in determining the direction of the comparison.
Trend
This comparison measures the indicator’s values over multiple time periods.<br>The Mann-Kendall Test for Statistical Significance is used to evaluate the trend<br>over 4 to 10 periods of measure, subject to data availability and comparability.
HP 2030 Target
(16.9)
County: Washtenaw All Cancer Incidence Rate
County: Washtenaw All Cancer Incidence Rate
428.1
Cases per 100,000 population
(2016-2020)
Compared to:
MI Counties
The distribution is based on data from 83 Michigan counties.
U.S. Counties
The distribution is based on data from 2,693 U.S. counties and county equivalents.
MI Value
(438.2)
The regional value is compared to the Michigan State value.
US Value
(442.3)
The regional value is compared to the national value.
Prior Value
(434.8)
Prior Value compares a measured value with the previously measured value. Confidence intervals were taken into account in determining the direction of the comparison.
Trend
This comparison measures the indicator’s values over multiple time periods.<br>The Mann-Kendall Test for Statistical Significance is used to evaluate the trend<br>over 4 to 10 periods of measure, subject to data availability and comparability.
County: Washtenaw Breast Cancer Incidence Rate
County: Washtenaw Breast Cancer Incidence Rate
130.0
Cases per 100,000 females
(2016-2020)
Compared to:
MI Counties
The distribution is based on data from 82 Michigan counties.
U.S. Counties
The distribution is based on data from 2,478 U.S. counties and county equivalents.
MI Value
(122.7)
The regional value is compared to the Michigan State value.
US Value
(127.0)
The regional value is compared to the national value.
Prior Value
(132.9)
Prior Value compares a measured value with the previously measured value. Confidence intervals were taken into account in determining the direction of the comparison.
Trend
This comparison measures the indicator’s values over multiple time periods.<br>The Mann-Kendall Test for Statistical Significance is used to evaluate the trend<br>over 4 to 10 periods of measure, subject to data availability and comparability.
County: Washtenaw Cancer: Medicare Population
County: Washtenaw Cancer: Medicare Population
12.0%
(2022)
Compared to:

MI Counties
The distribution is based on data from 83 Michigan counties.
U.S. Counties
The distribution is based on data from 3,129 U.S. counties and county equivalents.
MI Value
(11.0%)
The regional value is compared to the Michigan State value.
US Value
(12.0%)
The regional value is compared to the national value.
Prior Value
(12.0%)
Prior Value compares a measured value with the previously measured value. Confidence intervals were not taken into account in determining the direction of the comparison.
Trend
This comparison measures the indicator’s values over multiple time periods.<br>The Mann-Kendall Test for Statistical Significance is used to evaluate the trend<br>over 4 to 10 periods of measure, subject to data availability and comparability.
County: Washtenaw Colorectal Cancer Incidence Rate
County: Washtenaw Colorectal Cancer Incidence Rate
29.3
Cases per 100,000 population
(2016-2020)
Compared to:
MI Counties
The distribution is based on data from 81 Michigan counties.
U.S. Counties
The distribution is based on data from 2,401 U.S. counties and county equivalents.
MI Value
(35.6)
The regional value is compared to the Michigan State value.
US Value
(36.5)
The regional value is compared to the national value.
Prior Value
(29.7)
Prior Value compares a measured value with the previously measured value. Confidence intervals were taken into account in determining the direction of the comparison.
Trend
This comparison measures the indicator’s values over multiple time periods.<br>The Mann-Kendall Test for Statistical Significance is used to evaluate the trend<br>over 4 to 10 periods of measure, subject to data availability and comparability.
County: Washtenaw Lung and Bronchus Cancer Incidence Rate
County: Washtenaw Lung and Bronchus Cancer Incidence Rate
45.0
Cases per 100,000 population
(2016-2020)
Compared to:
MI Counties
The distribution is based on data from 82 Michigan counties.
U.S. Counties
The distribution is based on data from 2,471 U.S. counties and county equivalents.
MI Value
(59.6)
The regional value is compared to the Michigan State value.
US Value
(54.0)
The regional value is compared to the national value.
Prior Value
(45.8)
Prior Value compares a measured value with the previously measured value. Confidence intervals were taken into account in determining the direction of the comparison.
Trend
This comparison measures the indicator’s values over multiple time periods.<br>The Mann-Kendall Test for Statistical Significance is used to evaluate the trend<br>over 4 to 10 periods of measure, subject to data availability and comparability.
County: Washtenaw Mammography Screening: Medicare Population
County: Washtenaw Mammography Screening: Medicare Population
50.0%
(2022)
Compared to:
MI Counties
The distribution is based on data from 83 Michigan counties.
U.S. Counties
The distribution is based on data from 3,123 U.S. counties and county equivalents.
MI Value
(49.0%)
The regional value is compared to the Michigan State value.
US Value
(47.0%)
The regional value is compared to the national value.
Prior Value
(47.0%)
Prior Value compares a measured value with the previously measured value. Confidence intervals were not taken into account in determining the direction of the comparison.
Trend
This comparison measures the indicator’s values over multiple time periods.<br>The Mann-Kendall Test for Statistical Significance is used to evaluate the trend<br>over 4 to 10 periods of measure, subject to data availability and comparability.
County: Washtenaw Oral Cavity and Pharynx Cancer Incidence Rate
County: Washtenaw Oral Cavity and Pharynx Cancer Incidence Rate
11.3
Cases per 100,000 population
(2016-2020)
Compared to:
MI Counties
The distribution is based on data from 66 Michigan counties.
U.S. Counties
The distribution is based on data from 1,706 U.S. counties and county equivalents.
MI Value
(11.8)
The regional value is compared to the Michigan State value.
US Value
(11.9)
The regional value is compared to the national value.
Prior Value
(11.5)
Prior Value compares a measured value with the previously measured value. Confidence intervals were taken into account in determining the direction of the comparison.
Trend
This comparison measures the indicator’s values over multiple time periods.<br>The Mann-Kendall Test for Statistical Significance is used to evaluate the trend<br>over 4 to 10 periods of measure, subject to data availability and comparability.
County: Washtenaw Prostate Cancer Incidence Rate
County: Washtenaw Prostate Cancer Incidence Rate
128.0
Cases per 100,000 males
(2016-2020)
Compared to:
MI Counties
The distribution is based on data from 82 Michigan counties.
U.S. Counties
The distribution is based on data from 2,500 U.S. counties and county equivalents.
MI Value
(112.1)
The regional value is compared to the Michigan State value.
US Value
(110.5)
The regional value is compared to the national value.
Prior Value
(127.7)
Prior Value compares a measured value with the previously measured value. Confidence intervals were taken into account in determining the direction of the comparison.
Trend
This comparison measures the indicator’s values over multiple time periods.<br>The Mann-Kendall Test for Statistical Significance is used to evaluate the trend<br>over 4 to 10 periods of measure, subject to data availability and comparability.
County: Washtenaw
Health / Diabetes
Value
Compared to:
County: Washtenaw Diabetes: Medicare Population
County: Washtenaw Diabetes: Medicare Population
20.0%
(2022)
Compared to:
MI Counties
The distribution is based on data from 83 Michigan counties.
U.S. Counties
The distribution is based on data from 3,129 U.S. counties and county equivalents.
MI Value
(25.0%)
The regional value is compared to the Michigan State value.
US Value
(24.0%)
The regional value is compared to the national value.
Prior Value
(20.0%)
Prior Value compares a measured value with the previously measured value. Confidence intervals were not taken into account in determining the direction of the comparison.
Trend
This comparison measures the indicator’s values over multiple time periods.<br>The Mann-Kendall Test for Statistical Significance is used to evaluate the trend<br>over 4 to 10 periods of measure, subject to data availability and comparability.
County: Washtenaw
Health / Disabilities
Value
Compared to:
County: Washtenaw Children with a Disability
County: Washtenaw Children with a Disability
4.1%
(2018-2022)
Compared to:


MI Value
(4.8%)
The regional value is compared to the Michigan State value.
US Value
(4.5%)
The regional value is compared to the national value.
Trend
This comparison measures the indicator’s values over multiple time periods.<br>The Mann-Kendall Test for Statistical Significance is used to evaluate the trend<br>over 4 to 10 periods of measure, subject to data availability and comparability.
County: Washtenaw Persons with a Cognitive Difficulty
County: Washtenaw Persons with a Cognitive Difficulty
4.6%
(2018-2022)
Compared to:
MI Value
(6.0%)
The regional value is compared to the Michigan State value.
US Value
(5.3%)
The regional value is compared to the national value.
Trend
This comparison measures the indicator’s values over multiple time periods.<br>The Mann-Kendall Test for Statistical Significance is used to evaluate the trend<br>over 4 to 10 periods of measure, subject to data availability and comparability.
County: Washtenaw Persons with a Disability
County: Washtenaw Persons with a Disability
10.1%
(2018-2022)
Compared to:
MI Value
(14.1%)
The regional value is compared to the Michigan State value.
US Value
(12.9%)
The regional value is compared to the national value.
Trend
This comparison measures the indicator’s values over multiple time periods.<br>The Mann-Kendall Test for Statistical Significance is used to evaluate the trend<br>over 4 to 10 periods of measure, subject to data availability and comparability.
County: Washtenaw Persons with a Hearing Difficulty
County: Washtenaw Persons with a Hearing Difficulty
2.6%
(2018-2022)
Compared to:
MI Value
(3.8%)
The regional value is compared to the Michigan State value.
US Value
(3.6%)
The regional value is compared to the national value.
Trend
This comparison measures the indicator’s values over multiple time periods.<br>The Mann-Kendall Test for Statistical Significance is used to evaluate the trend<br>over 4 to 10 periods of measure, subject to data availability and comparability.
County: Washtenaw Persons with a Self-Care Difficulty
County: Washtenaw Persons with a Self-Care Difficulty
1.7%
(2018-2022)
Compared to:

MI Value
(2.8%)
The regional value is compared to the Michigan State value.
US Value
(2.6%)
The regional value is compared to the national value.
Trend
This comparison measures the indicator’s values over multiple time periods.<br>The Mann-Kendall Test for Statistical Significance is used to evaluate the trend<br>over 4 to 10 periods of measure, subject to data availability and comparability.
County: Washtenaw Persons with a Vision Difficulty
County: Washtenaw Persons with a Vision Difficulty
1.3%
(2018-2022)
Compared to:
MI Value
(2.2%)
The regional value is compared to the Michigan State value.
US Value
(2.4%)
The regional value is compared to the national value.
Trend
This comparison measures the indicator’s values over multiple time periods.<br>The Mann-Kendall Test for Statistical Significance is used to evaluate the trend<br>over 4 to 10 periods of measure, subject to data availability and comparability.
County: Washtenaw Persons with an Ambulatory Difficulty
County: Washtenaw Persons with an Ambulatory Difficulty
4.5%
(2018-2022)
Compared to:

MI Value
(7.2%)
The regional value is compared to the Michigan State value.
US Value
(6.7%)
The regional value is compared to the national value.
Trend
This comparison measures the indicator’s values over multiple time periods.<br>The Mann-Kendall Test for Statistical Significance is used to evaluate the trend<br>over 4 to 10 periods of measure, subject to data availability and comparability.
County: Washtenaw
Health / Family Planning
Value
Compared to:
County: Washtenaw Teens who are Sexually Active: 9th, 11th Graders
County: Washtenaw Teens who are Sexually Active: 9th, 11th Graders
15.8%
(2020)
Compared to:

MI Value
(24.4%)
The regional value is compared to the 2019 Michigan state value for 9th - 12th graders.
Prior Value
(14.6%)
Prior Value compares a measured value with the previously measured value. Confidence intervals were not taken into account in determining the direction of the comparison.
Trend
This comparison measures the indicator’s values over multiple time periods.<br>The Mann-Kendall Test for Statistical Significance is used to evaluate the trend<br>over 4 to 10 periods of measure, subject to data availability and comparability.
County: Washtenaw
Health / Health Care Access & Quality
Value
Compared to:
County: Washtenaw Adults with Health Insurance
County: Washtenaw Adults with Health Insurance
95.5%
(2022)
Compared to:
U.S. Counties
The distribution is based on data from 828 U.S. counties and county equivalents.
MI Value
(93.4%)
The regional value is compared to the Michigan State value.
US Value
(88.7%)
The regional value is compared to the national value.
Prior Value
(95.0%)
Prior Value compares a measured value with the previously measured value. Confidence intervals were taken into account in determining the direction of the comparison.
Trend
This comparison measures the indicator’s values over multiple time periods.<br>The Mann-Kendall Test for Statistical Significance is used to evaluate the trend<br>over 4 to 10 periods of measure, subject to data availability and comparability.
County: Washtenaw Children with Health Insurance
County: Washtenaw Children with Health Insurance
98.3%
(2022)
Compared to:

U.S. Counties
The distribution is based on data from 828 U.S. counties and county equivalents.
MI Value
(97.3%)
The regional value is compared to the Michigan State value.
US Value
(94.9%)
The regional value is compared to the national value.
Prior Value
(97.3%)
Prior Value compares a measured value with the previously measured value. Confidence intervals were taken into account in determining the direction of the comparison.
Trend
This comparison measures the indicator’s values over multiple time periods.<br>The Mann-Kendall Test for Statistical Significance is used to evaluate the trend<br>over 4 to 10 periods of measure, subject to data availability and comparability.
County: Washtenaw Persons with Health Insurance
County: Washtenaw Persons with Health Insurance
94.9%
(2021)
Compared to:
MI Counties
The distribution is based on data from 83 Michigan counties.
U.S. Counties
The distribution is based on data from 3,140 U.S. counties and county equivalents.
MI Value
(94.0%)
The regional value is compared to the Michigan State value.
Prior Value
(94.9%)
Prior Value compares a measured value with the previously measured value. Confidence intervals were taken into account in determining the direction of the comparison.
Trend
This comparison measures the indicator’s values over multiple time periods.<br>The Mann-Kendall Test for Statistical Significance is used to evaluate the trend<br>over 4 to 10 periods of measure, subject to data availability and comparability.
HP 2030 Target
(92.4%)
<div>AHS-01: Increase the proportion of people with health insurance <strong>(LEADING HEALTH INDICATOR)</strong></div>
County: Washtenaw Persons with Private Health Insurance Only
County: Washtenaw Persons with Private Health Insurance Only
67.1%
(2022)
Compared to:


MI Value
(54.5%)
The regional value is compared to the Michigan State value.
US Value
(54.8%)
The regional value is compared to the national value.
Prior Value
(67.4%)
Prior Value compares a measured value with the previously measured value. Confidence intervals were not taken into account in determining the direction of the comparison.
Trend
This comparison measures the indicator’s values over multiple time periods.<br>The Mann-Kendall Test for Statistical Significance is used to evaluate the trend<br>over 4 to 10 periods of measure, subject to data availability and comparability.
County: Washtenaw Persons with Public Health Insurance Only
County: Washtenaw Persons with Public Health Insurance Only
15.7%
(2022)
Compared to:

MI Value
(25.1%)
The regional value is compared to the Michigan State value.
US Value
(24.8%)
The regional value is compared to the national value.
Prior Value
(15.3%)
Prior Value compares a measured value with the previously measured value. Confidence intervals were not taken into account in determining the direction of the comparison.
Trend
This comparison measures the indicator’s values over multiple time periods.<br>The Mann-Kendall Test for Statistical Significance is used to evaluate the trend<br>over 4 to 10 periods of measure, subject to data availability and comparability.
County: Washtenaw Preventable Hospital Stays: Medicare Population
County: Washtenaw Preventable Hospital Stays: Medicare Population
2,909.0
Discharges per 100,000 Medicare enrollees
(2022)
Compared to:
MI Counties
The distribution is based on data from 83 Michigan counties.
U.S. Counties
The distribution is based on data from 3,129 U.S. counties and county equivalents.
MI Value
(3,261.0)
The regional value is compared to the Michigan State value.
US Value
(2,677.0)
The regional value is compared to the national value.
Prior Value
(3,043.0)
Prior Value compares a measured value with the previously measured value. Confidence intervals were not taken into account in determining the direction of the comparison.
Trend
This comparison measures the indicator’s values over multiple time periods.<br>The Mann-Kendall Test for Statistical Significance is used to evaluate the trend<br>over 4 to 10 periods of measure, subject to data availability and comparability.
County: Washtenaw
Health / Health Information Technology
Value
Compared to:
County: Washtenaw Persons with an Internet Subscription
County: Washtenaw Persons with an Internet Subscription
94.7%
(2018-2022)
Compared to:
MI Counties
The distribution is based on data from 83 Michigan counties.
U.S. Counties
The distribution is based on data from 3,133 U.S. counties and county equivalents.
MI Value
(90.8%)
The regional value is compared to the Michigan State value.
US Value
(91.0%)
The regional value is compared to the national value.
Trend
This comparison measures the indicator’s values over multiple time periods.<br>The Mann-Kendall Test for Statistical Significance is used to evaluate the trend<br>over 4 to 10 periods of measure, subject to data availability and comparability.
County: Washtenaw
Health / Heart Disease & Stroke
Value
Compared to:
County: Washtenaw Adults who Have been Told They Had a Heart Attack
County: Washtenaw Adults who Have been Told They Had a Heart Attack
2.6%
% of adults
(2015)
Compared to:
Prior Value
(1.5%)
Prior Value compares a measured value with the previously measured value. Confidence intervals were not taken into account in determining the direction of the comparison.
County: Washtenaw Age-Adjusted Hospitalization Rate due to Heart Attack
County: Washtenaw Age-Adjusted Hospitalization Rate due to Heart Attack
31.7
Hospitalizations per 10,000 population 35+ years
(2020)
Compared to:
MI Counties
The distribution is based on data from 83 Michigan counties.
MI Value
(30.8)
The regional value is compared to the Michigan State value.
Prior Value
(38.5)
Prior Value compares a measured value with the previously measured value. Confidence intervals were not taken into account in determining the direction of the comparison.
Trend
This comparison measures the indicator’s values over multiple time periods.<br>The Mann-Kendall Test for Statistical Significance is used to evaluate the trend<br>over 4 to 10 periods of measure, subject to data availability and comparability.
County: Washtenaw Atrial Fibrillation: Medicare Population
County: Washtenaw Atrial Fibrillation: Medicare Population
13.0%
(2022)
Compared to:
MI Counties
The distribution is based on data from 83 Michigan counties.
U.S. Counties
The distribution is based on data from 3,129 U.S. counties and county equivalents.
MI Value
(15.0%)
The regional value is compared to the Michigan State value.
US Value
(14.0%)
The regional value is compared to the national value.
Prior Value
(13.0%)
Prior Value compares a measured value with the previously measured value. Confidence intervals were not taken into account in determining the direction of the comparison.
Trend
This comparison measures the indicator’s values over multiple time periods.<br>The Mann-Kendall Test for Statistical Significance is used to evaluate the trend<br>over 4 to 10 periods of measure, subject to data availability and comparability.
County: Washtenaw Heart Failure: Medicare Population
County: Washtenaw Heart Failure: Medicare Population
10.0%
(2022)
Compared to:
MI Counties
The distribution is based on data from 83 Michigan counties.
U.S. Counties
The distribution is based on data from 3,129 U.S. counties and county equivalents.
MI Value
(13.0%)
The regional value is compared to the Michigan State value.
US Value
(11.0%)
The regional value is compared to the national value.
Prior Value
(10.0%)
Prior Value compares a measured value with the previously measured value. Confidence intervals were not taken into account in determining the direction of the comparison.
Trend
This comparison measures the indicator’s values over multiple time periods.<br>The Mann-Kendall Test for Statistical Significance is used to evaluate the trend<br>over 4 to 10 periods of measure, subject to data availability and comparability.
County: Washtenaw Hyperlipidemia: Medicare Population
County: Washtenaw Hyperlipidemia: Medicare Population
52.0%
(2022)
Compared to:
MI Counties
The distribution is based on data from 83 Michigan counties.
U.S. Counties
The distribution is based on data from 3,129 U.S. counties and county equivalents.
MI Value
(62.0%)
The regional value is compared to the Michigan State value.
US Value
(65.0%)
The regional value is compared to the national value.
Prior Value
(50.0%)
Prior Value compares a measured value with the previously measured value. Confidence intervals were not taken into account in determining the direction of the comparison.
Trend
This comparison measures the indicator’s values over multiple time periods.<br>The Mann-Kendall Test for Statistical Significance is used to evaluate the trend<br>over 4 to 10 periods of measure, subject to data availability and comparability.
County: Washtenaw Hypertension: Medicare Population
County: Washtenaw Hypertension: Medicare Population
57.0%
(2022)
Compared to:
MI Counties
The distribution is based on data from 83 Michigan counties.
U.S. Counties
The distribution is based on data from 3,129 U.S. counties and county equivalents.
MI Value
(66.0%)
The regional value is compared to the Michigan State value.
US Value
(65.0%)
The regional value is compared to the national value.
Prior Value
(56.0%)
Prior Value compares a measured value with the previously measured value. Confidence intervals were not taken into account in determining the direction of the comparison.
Trend
This comparison measures the indicator’s values over multiple time periods.<br>The Mann-Kendall Test for Statistical Significance is used to evaluate the trend<br>over 4 to 10 periods of measure, subject to data availability and comparability.
County: Washtenaw Ischemic Heart Disease: Medicare Population
County: Washtenaw Ischemic Heart Disease: Medicare Population
17.0%
(2022)
Compared to:
MI Counties
The distribution is based on data from 83 Michigan counties.
U.S. Counties
The distribution is based on data from 3,129 U.S. counties and county equivalents.
MI Value
(22.0%)
The regional value is compared to the Michigan State value.
US Value
(21.0%)
The regional value is compared to the national value.
Prior Value
(16.0%)
Prior Value compares a measured value with the previously measured value. Confidence intervals were not taken into account in determining the direction of the comparison.
Trend
This comparison measures the indicator’s values over multiple time periods.<br>The Mann-Kendall Test for Statistical Significance is used to evaluate the trend<br>over 4 to 10 periods of measure, subject to data availability and comparability.
County: Washtenaw Stroke: Medicare Population
County: Washtenaw Stroke: Medicare Population
5.0%
(2022)
Compared to:
MI Counties
The distribution is based on data from 83 Michigan counties.
U.S. Counties
The distribution is based on data from 3,129 U.S. counties and county equivalents.
MI Value
(6.0%)
The regional value is compared to the Michigan State value.
US Value
(6.0%)
The regional value is compared to the national value.
Prior Value
(5.0%)
Prior Value compares a measured value with the previously measured value. Confidence intervals were not taken into account in determining the direction of the comparison.
Trend
This comparison measures the indicator’s values over multiple time periods.<br>The Mann-Kendall Test for Statistical Significance is used to evaluate the trend<br>over 4 to 10 periods of measure, subject to data availability and comparability.
County: Washtenaw
Health / Immunizations & Infectious Diseases
Value
Compared to:
County: Washtenaw Flu Vaccinations: Medicare Population
County: Washtenaw Flu Vaccinations: Medicare Population
54.0%
(2022)
Compared to:

MI Counties
The distribution is based on data from 83 Michigan counties.
U.S. Counties
The distribution is based on data from 3,129 U.S. counties and county equivalents.
MI Value
(47.0%)
The regional value is compared to the Michigan State value.
US Value
(50.0%)
The regional value is compared to the national value.
Prior Value
(57.0%)
Prior Value compares a measured value with the previously measured value. Confidence intervals were not taken into account in determining the direction of the comparison.
Trend
This comparison measures the indicator’s values over multiple time periods.<br>The Mann-Kendall Test for Statistical Significance is used to evaluate the trend<br>over 4 to 10 periods of measure, subject to data availability and comparability.
County: Washtenaw Persons Fully Vaccinated Against COVID-19
County: Washtenaw Persons Fully Vaccinated Against COVID-19
74.3%
(May 10, 2023)
Compared to:
MI Counties
The distribution is based on data from 83 Michigan counties.
U.S. Counties
The distribution is based on data from 3,125 U.S. counties and county equivalents.
Prior Value
(74.3%)
Prior Value compares a measured value with the previously measured value. Confidence intervals were not taken into account in determining the direction of the comparison.
Trend
This comparison measures the indicator’s values over multiple time periods.<br>The Mann-Kendall Test for Statistical Significance is used to evaluate the trend<br>over 4 to 10 periods of measure, subject to data availability and comparability.
County: Washtenaw Pneumonia Vaccinations: Medicare Population
County: Washtenaw Pneumonia Vaccinations: Medicare Population
9.0%
(2022)
Compared to:

MI Counties
The distribution is based on data from 83 Michigan counties.
U.S. Counties
The distribution is based on data from 3,129 U.S. counties and county equivalents.
MI Value
(7.0%)
The regional value is compared to the Michigan State value.
US Value
(8.0%)
The regional value is compared to the national value.
Prior Value
(6.0%)
Prior Value compares a measured value with the previously measured value. Confidence intervals were not taken into account in determining the direction of the comparison.
Trend
This comparison measures the indicator’s values over multiple time periods.<br>The Mann-Kendall Test for Statistical Significance is used to evaluate the trend<br>over 4 to 10 periods of measure, subject to data availability and comparability.
County: Washtenaw
Health / Maternal, Fetal & Infant Health
Value
Compared to:
County: Washtenaw Babies with Low Birthweight
County: Washtenaw Babies with Low Birthweight
7.7%
(2022)
Compared to:
MI Counties
The distribution is based on data from 72 Michigan counties.
MI Value
(9.2%)
The regional value is compared to the Michigan State value.
US Value
(8.5% in 2021)
The regional value is compared to the national value. The source for the national value is Centers for Disease Control and Prevention
Prior Value
(8.1%)
Prior Value compares a measured value with the previously measured value. Confidence intervals were not taken into account in determining the direction of the comparison.
Trend
This comparison measures the indicator’s values over multiple time periods.<br>The Mann-Kendall Test for Statistical Significance is used to evaluate the trend<br>over 4 to 10 periods of measure, subject to data availability and comparability.
County: Washtenaw Infant Mortality Rate
County: Washtenaw Infant Mortality Rate
5.7
Deaths per 1,000 live births
(2020-2022)
Compared to:
MI Value
(6.5)
The regional value is compared to the Michigan State value.
US Value
(5.5 in 2019-2021)
The regional value is compared to the national value. The source for the national value is Centers for Disease Control and Prevention
Prior Value
(5.6)
Prior Value compares a measured value with the previously measured value. Confidence intervals were taken into account in determining the direction of the comparison.
Trend
This comparison measures the indicator’s values over multiple time periods.<br>The Mann-Kendall Test for Statistical Significance is used to evaluate the trend<br>over 4 to 10 periods of measure, subject to data availability and comparability.
HP 2030 Target
(5.0)
<div>MICH-02: Reduce the rate of infant deaths <strong>(LEADING HEALTH INDICATOR)</strong></div>
County: Washtenaw Mothers who Received Early Prenatal Care
County: Washtenaw Mothers who Received Early Prenatal Care
80.9%
(2022)
Compared to:
MI Counties
The distribution is based on data from 83 Michigan counties.
MI Value
(76.3%)
The regional value is compared to the Michigan State value.
US Value
(78.3% in 2021)
The regional value is compared to the national value. The source for the national value is Centers for Disease Control and Prevention
Prior Value
(78.2%)
Prior Value compares a measured value with the previously measured value. Confidence intervals were not taken into account in determining the direction of the comparison.
Trend
This comparison measures the indicator’s values over multiple time periods.<br>The Mann-Kendall Test for Statistical Significance is used to evaluate the trend<br>over 4 to 10 periods of measure, subject to data availability and comparability.
County: Washtenaw Mothers who Smoked During Pregnancy
County: Washtenaw Mothers who Smoked During Pregnancy
4.6%
(2022)
Compared to:
MI Counties
The distribution is based on data from 82 Michigan counties.
MI Value
(8.5%)
The regional value is compared to the Michigan State value.
US Value
(4.6% in 2021)
The regional value is compared to the national value. The source for the national value is Centers for Disease Control and Prevention
Prior Value
(5.4%)
Prior Value compares a measured value with the previously measured value. Confidence intervals were not taken into account in determining the direction of the comparison.
Trend
This comparison measures the indicator’s values over multiple time periods.<br>The Mann-Kendall Test for Statistical Significance is used to evaluate the trend<br>over 4 to 10 periods of measure, subject to data availability and comparability.
HP 2030 Target
(4.3%)
County: Washtenaw Preterm Births
County: Washtenaw Preterm Births
8.5%
(2022)
Compared to:
MI Counties
The distribution is based on data from 75 Michigan counties.
MI Value
(10.4%)
The regional value is compared to the Michigan State value.
US Value
(10.5% in 2021)
The regional value is compared to the national value. The source for the national value is Centers for Disease Control and Prevention
Prior Value
(10.3%)
Prior Value compares a measured value with the previously measured value. Confidence intervals were not taken into account in determining the direction of the comparison.
Trend
This comparison measures the indicator’s values over multiple time periods.<br>The Mann-Kendall Test for Statistical Significance is used to evaluate the trend<br>over 4 to 10 periods of measure, subject to data availability and comparability.
HP 2030 Target
(9.4%)
County: Washtenaw WIC Enrollment Data
County: Washtenaw WIC Enrollment Data
5,093
Persons
(July 2023)
Compared to:
Prior Value
(4,975)
Prior Value compares a measured value with the previously measured value. Confidence intervals were not taken into account in determining the direction of the comparison.
Trend
This comparison measures the indicator’s values over multiple time periods.<br>The Mann-Kendall Test for Statistical Significance is used to evaluate the trend<br>over 4 to 10 periods of measure, subject to data availability and comparability.
County: Washtenaw
Health / Mental Health & Mental Disorders
Value
Compared to:
County: Washtenaw Depression: Medicare Population
County: Washtenaw Depression: Medicare Population
19.0%
(2022)
Compared to:
MI Counties
The distribution is based on data from 83 Michigan counties.
U.S. Counties
The distribution is based on data from 3,129 U.S. counties and county equivalents.
MI Value
(18.0%)
The regional value is compared to the Michigan State value.
US Value
(16.0%)
The regional value is compared to the national value.
Prior Value
(19.0%)
Prior Value compares a measured value with the previously measured value. Confidence intervals were not taken into account in determining the direction of the comparison.
Trend
This comparison measures the indicator’s values over multiple time periods.<br>The Mann-Kendall Test for Statistical Significance is used to evaluate the trend<br>over 4 to 10 periods of measure, subject to data availability and comparability.
County: Washtenaw Suicide Completions
County: Washtenaw Suicide Completions
44
Number of completions
(2022)
Compared to:
Prior Value
(47)
Prior Value compares a measured value with the previously measured value. Confidence intervals were not taken into account in determining the direction of the comparison.
Trend
This comparison measures the indicator’s values over multiple time periods.<br>The Mann-Kendall Test for Statistical Significance is used to evaluate the trend<br>over 4 to 10 periods of measure, subject to data availability and comparability.
37.6%
(2022)
Compared to:
MI Value
(36.4% in 2020)
The regional value is compared to the 2019 Michigan state value for 9th - 12th graders.
Prior Value
(31.5%)
Prior Value compares a measured value with the previously measured value. Confidence intervals were not taken into account in determining the direction of the comparison.
Trend
This comparison measures the indicator’s values over multiple time periods.<br>The Mann-Kendall Test for Statistical Significance is used to evaluate the trend<br>over 4 to 10 periods of measure, subject to data availability and comparability.
County: Washtenaw
Health / Mortality Data
Value
Compared to:
County: Washtenaw Life Expectancy
County: Washtenaw Life Expectancy
80.4
Years
(2019-2021)
Compared to:
MI Counties
The distribution is based on data from 83 Michigan counties.
U.S. Counties
The distribution is based on data from 3,070 U.S. counties and county equivalents.
MI Value
(76.6)
The regional value is compared to the Michigan State value.
US Value
(77.6)
The regional value is compared to the national value.
County: Washtenaw Premature Death
County: Washtenaw Premature Death
5,624.1
Years per 100,000 population
(2019-2021)
Compared to:
MI Counties
The distribution is based on data from 81 Michigan counties.
U.S. Counties
The distribution is based on data from 2,886 U.S. counties and county equivalents.
MI Value
(8,467.6)
The regional value is compared to the Michigan State value.
US Value
(7,971.5)
The regional value is compared to the national value.
County: Washtenaw
Health / Nutrition & Healthy Eating
Value
Compared to:
County: Washtenaw Adults who Eat Fast Food More Than Once per Week
County: Washtenaw Adults who Eat Fast Food More Than Once per Week
14.6%
% of adults
(2015)
Compared to:
Prior Value
(18.9%)
Prior Value compares a measured value with the previously measured value. Confidence intervals were not taken into account in determining the direction of the comparison.
County: Washtenaw Child Low Fruit and Vegetable Consumption
County: Washtenaw Child Low Fruit and Vegetable Consumption
16.0%
%
(2015)
Compared to:
Prior Value
(12.9%)
Prior Value compares a measured value with the previously measured value. Confidence intervals were not taken into account in determining the direction of the comparison.
County: Washtenaw Children who Drink No Sweetened Beverages
County: Washtenaw Children who Drink No Sweetened Beverages
82.6%
% of children
(2015)
Compared to:
Prior Value
(68.4%)
Prior Value compares a measured value with the previously measured value. Confidence intervals were not taken into account in determining the direction of the comparison.
23.1%
(2022)
Compared to:
Prior Value
(29.5%)
Prior Value compares a measured value with the previously measured value. Confidence intervals were not taken into account in determining the direction of the comparison.
Trend
This comparison measures the indicator’s values over multiple time periods.<br>The Mann-Kendall Test for Statistical Significance is used to evaluate the trend<br>over 4 to 10 periods of measure, subject to data availability and comparability.
County: Washtenaw Teens who Drank Soda or Pop in the Last Week: 9th, 11th Graders
County: Washtenaw Teens who Drank Soda or Pop in the Last Week: 9th, 11th Graders
9.4%
(2022)
Compared to:
MI Value
(14.2% in 2020)
The regional value is compared to the 2019 Michigan state value for 9th - 12th graders.
Prior Value
(10.8%)
Prior Value compares a measured value with the previously measured value. Confidence intervals were not taken into account in determining the direction of the comparison.
Trend
This comparison measures the indicator’s values over multiple time periods.<br>The Mann-Kendall Test for Statistical Significance is used to evaluate the trend<br>over 4 to 10 periods of measure, subject to data availability and comparability.
County: Washtenaw
Health / Older Adults
Value
Compared to:
County: Washtenaw Adults 65+ with a Disability
County: Washtenaw Adults 65+ with a Disability
27.9%
(2018-2022)
Compared to:
MI Value
(32.7%)
The regional value is compared to the Michigan State value.
US Value
(33.3%)
The regional value is compared to the national value.
Trend
This comparison measures the indicator’s values over multiple time periods.<br>The Mann-Kendall Test for Statistical Significance is used to evaluate the trend<br>over 4 to 10 periods of measure, subject to data availability and comparability.
County: Washtenaw Adults 65+ with a Hearing Difficulty
County: Washtenaw Adults 65+ with a Hearing Difficulty
11.6%
(2018-2022)
Compared to:
MI Value
(13.6%)
The regional value is compared to the Michigan State value.
US Value
(13.7%)
The regional value is compared to the national value.
Trend
This comparison measures the indicator’s values over multiple time periods.<br>The Mann-Kendall Test for Statistical Significance is used to evaluate the trend<br>over 4 to 10 periods of measure, subject to data availability and comparability.
County: Washtenaw Adults 65+ with a Self-Care Difficulty
County: Washtenaw Adults 65+ with a Self-Care Difficulty
5.5%
(2018-2022)
Compared to:
MI Value
(6.8%)
The regional value is compared to the Michigan State value.
US Value
(7.4%)
The regional value is compared to the national value.
Trend
This comparison measures the indicator’s values over multiple time periods.<br>The Mann-Kendall Test for Statistical Significance is used to evaluate the trend<br>over 4 to 10 periods of measure, subject to data availability and comparability.
County: Washtenaw Adults 65+ with a Vision Difficulty
County: Washtenaw Adults 65+ with a Vision Difficulty
3.3%
(2018-2022)
Compared to:
MI Value
(5.3%)
The regional value is compared to the Michigan State value.
US Value
(6.0%)
The regional value is compared to the national value.
Trend
This comparison measures the indicator’s values over multiple time periods.<br>The Mann-Kendall Test for Statistical Significance is used to evaluate the trend<br>over 4 to 10 periods of measure, subject to data availability and comparability.
County: Washtenaw Adults 65+ with an Independent Living Difficulty
County: Washtenaw Adults 65+ with an Independent Living Difficulty
10.6%
(2018-2022)
Compared to:
MI Value
(13.1%)
The regional value is compared to the Michigan State value.
US Value
(13.6%)
The regional value is compared to the national value.
Trend
This comparison measures the indicator’s values over multiple time periods.<br>The Mann-Kendall Test for Statistical Significance is used to evaluate the trend<br>over 4 to 10 periods of measure, subject to data availability and comparability.
County: Washtenaw Alzheimer's Disease or Dementia: Medicare Population
County: Washtenaw Alzheimer's Disease or Dementia: Medicare Population
7.0%
(2022)
Compared to:
MI Counties
The distribution is based on data from 83 Michigan counties.
U.S. Counties
The distribution is based on data from 3,129 U.S. counties and county equivalents.
MI Value
(7.0%)
The regional value is compared to the Michigan State value.
US Value
(6.0%)
The regional value is compared to the national value.
Prior Value
(7.0%)
Prior Value compares a measured value with the previously measured value. Confidence intervals were not taken into account in determining the direction of the comparison.
Trend
This comparison measures the indicator’s values over multiple time periods.<br>The Mann-Kendall Test for Statistical Significance is used to evaluate the trend<br>over 4 to 10 periods of measure, subject to data availability and comparability.
County: Washtenaw
Health / Oral Health
Value
Compared to:
County: Washtenaw Children Enrolled in Medicaid who Visited the Dentist the Past Year
County: Washtenaw Children Enrolled in Medicaid who Visited the Dentist the Past Year
49.1%
%
(2022)
Compared to:
Prior Value
(48.8%)
Prior Value compares a measured value with the previously measured value. Confidence intervals were not taken into account in determining the direction of the comparison.
Trend
This comparison measures the indicator’s values over multiple time periods.<br>The Mann-Kendall Test for Statistical Significance is used to evaluate the trend<br>over 4 to 10 periods of measure, subject to data availability and comparability.
State of Michigan Target
(70%)
<div>This target is set forth by the State of Michigan. </div>
County: Washtenaw Medicaid Enrollees who Visited the Dentist in the Last Year
County: Washtenaw Medicaid Enrollees who Visited the Dentist in the Last Year
27.0%
%
(2022)
Compared to:
Prior Value
(28.1%)
Prior Value compares a measured value with the previously measured value. Confidence intervals were not taken into account in determining the direction of the comparison.
Trend
This comparison measures the indicator’s values over multiple time periods.<br>The Mann-Kendall Test for Statistical Significance is used to evaluate the trend<br>over 4 to 10 periods of measure, subject to data availability and comparability.
County: Washtenaw
Health / Other Conditions
Value
Compared to:
County: Washtenaw Chronic Kidney Disease: Medicare Population
County: Washtenaw Chronic Kidney Disease: Medicare Population
17.0%
(2022)
Compared to:
MI Counties
The distribution is based on data from 83 Michigan counties.
U.S. Counties
The distribution is based on data from 3,129 U.S. counties and county equivalents.
MI Value
(19.0%)
The regional value is compared to the Michigan State value.
US Value
(18.0%)
The regional value is compared to the national value.
Prior Value
(17.0%)
Prior Value compares a measured value with the previously measured value. Confidence intervals were not taken into account in determining the direction of the comparison.
Trend
This comparison measures the indicator’s values over multiple time periods.<br>The Mann-Kendall Test for Statistical Significance is used to evaluate the trend<br>over 4 to 10 periods of measure, subject to data availability and comparability.
County: Washtenaw Osteoporosis: Medicare Population
County: Washtenaw Osteoporosis: Medicare Population
13.0%
(2022)
Compared to:
MI Counties
The distribution is based on data from 83 Michigan counties.
U.S. Counties
The distribution is based on data from 3,129 U.S. counties and county equivalents.
MI Value
(10.0%)
The regional value is compared to the Michigan State value.
US Value
(11.0%)
The regional value is compared to the national value.
Prior Value
(12.0%)
Prior Value compares a measured value with the previously measured value. Confidence intervals were not taken into account in determining the direction of the comparison.
Trend
This comparison measures the indicator’s values over multiple time periods.<br>The Mann-Kendall Test for Statistical Significance is used to evaluate the trend<br>over 4 to 10 periods of measure, subject to data availability and comparability.
County: Washtenaw Rheumatoid Arthritis or Osteoarthritis: Medicare Population
County: Washtenaw Rheumatoid Arthritis or Osteoarthritis: Medicare Population
32.0%
(2022)
Compared to:
MI Counties
The distribution is based on data from 83 Michigan counties.
U.S. Counties
The distribution is based on data from 3,129 U.S. counties and county equivalents.
MI Value
(36.0%)
The regional value is compared to the Michigan State value.
US Value
(35.0%)
The regional value is compared to the national value.
Prior Value
(31.0%)
Prior Value compares a measured value with the previously measured value. Confidence intervals were not taken into account in determining the direction of the comparison.
Trend
This comparison measures the indicator’s values over multiple time periods.<br>The Mann-Kendall Test for Statistical Significance is used to evaluate the trend<br>over 4 to 10 periods of measure, subject to data availability and comparability.
County: Washtenaw
Health / Physical Activity
Value
Compared to:
County: Washtenaw Teens who Engage in Regular Physical Activity: 9th, 11th Graders
County: Washtenaw Teens who Engage in Regular Physical Activity: 9th, 11th Graders
63.4%
(2022)
Compared to:
MI Value
(44.7% in 2020)
The regional value is compared to the 2019 Michigan state value for 9th - 12th graders.
Prior Value
(59.2%)
Prior Value compares a measured value with the previously measured value. Confidence intervals were not taken into account in determining the direction of the comparison.
Trend
This comparison measures the indicator’s values over multiple time periods.<br>The Mann-Kendall Test for Statistical Significance is used to evaluate the trend<br>over 4 to 10 periods of measure, subject to data availability and comparability.
County: Washtenaw
Health / Prevention & Safety
Value
Compared to:
County: Washtenaw Age-Adjusted Death Rate due to Firearms
County: Washtenaw Age-Adjusted Death Rate due to Firearms
6.5
Deaths per 100,000 population
(2018-2020)
Compared to:
U.S. Counties
The distribution is based on data from 1,083 U.S. counties and county equivalents.
MI Value
(13.0)
The regional value is compared to the Michigan State value.
US Value
(12.0)
The regional value is compared to the national value.
Prior Value
(6.0)
Prior Value compares a measured value with the previously measured value. Confidence intervals were taken into account in determining the direction of the comparison.
Trend
This comparison measures the indicator’s values over multiple time periods.<br>The Mann-Kendall Test for Statistical Significance is used to evaluate the trend<br>over 4 to 10 periods of measure, subject to data availability and comparability.
HP 2030 Target
(10.7)
County: Washtenaw
Health / Respiratory Diseases
Value
Compared to:
County: Washtenaw Asthma: Medicare Population
County: Washtenaw Asthma: Medicare Population
7.0%
(2022)
Compared to:
MI Counties
The distribution is based on data from 83 Michigan counties.
U.S. Counties
The distribution is based on data from 3,129 U.S. counties and county equivalents.
MI Value
(7.0%)
The regional value is compared to the Michigan State value.
US Value
(7.0%)
The regional value is compared to the national value.
Prior Value
(7.0%)
Prior Value compares a measured value with the previously measured value. Confidence intervals were not taken into account in determining the direction of the comparison.
Trend
This comparison measures the indicator’s values over multiple time periods.<br>The Mann-Kendall Test for Statistical Significance is used to evaluate the trend<br>over 4 to 10 periods of measure, subject to data availability and comparability.
County: Washtenaw COPD: Medicare Population
County: Washtenaw COPD: Medicare Population
8.0%
(2022)
Compared to:
MI Counties
The distribution is based on data from 83 Michigan counties.
U.S. Counties
The distribution is based on data from 3,129 U.S. counties and county equivalents.
MI Value
(13.0%)
The regional value is compared to the Michigan State value.
US Value
(11.0%)
The regional value is compared to the national value.
Prior Value
(8.0%)
Prior Value compares a measured value with the previously measured value. Confidence intervals were not taken into account in determining the direction of the comparison.
Trend
This comparison measures the indicator’s values over multiple time periods.<br>The Mann-Kendall Test for Statistical Significance is used to evaluate the trend<br>over 4 to 10 periods of measure, subject to data availability and comparability.
County: Washtenaw Teens with Asthma
County: Washtenaw Teens with Asthma
20.6%
(2022)
Compared to:
MI Value
(24.2% in 2020)
The regional value is compared to the 2019 Michigan state value for 9th - 12th graders.
Prior Value
(19.5%)
Prior Value compares a measured value with the previously measured value. Confidence intervals were not taken into account in determining the direction of the comparison.
Trend
This comparison measures the indicator’s values over multiple time periods.<br>The Mann-Kendall Test for Statistical Significance is used to evaluate the trend<br>over 4 to 10 periods of measure, subject to data availability and comparability.
County: Washtenaw
Health / Sexually Transmitted Infections
Value
Compared to:
County: Washtenaw Chlamydia Incidence Rate
County: Washtenaw Chlamydia Incidence Rate
426
Cases per 100,000 population
(2020)
Compared to:
MI Counties
The distribution is based on data from 52 Michigan counties.
MI Value
(449)
The regional value is compared to the Michigan State value.
US Value
(481.3)
The regional value is compared to the national value. The source for the national value is National Center for HIV/AIDS, Viral Hepatitis, STD, and TB Prevention
Prior Value
(491)
Prior Value compares a measured value with the previously measured value. Confidence intervals were not taken into account in determining the direction of the comparison.
Trend
This comparison measures the indicator’s values over multiple time periods.<br>The Mann-Kendall Test for Statistical Significance is used to evaluate the trend<br>over 4 to 10 periods of measure, subject to data availability and comparability.
County: Washtenaw Gonorrhea Incidence Rate
County: Washtenaw Gonorrhea Incidence Rate
168
Cases per 100,000 population
(2020)
Compared to:
MI Value
(234)
The regional value is compared to the Michigan State value.
US Value
(206.5)
The regional value is compared to the national value. The source for the national value is National Center for HIV/AIDS, Viral Hepatitis, STD, and TB Prevention
Prior Value
(156)
Prior Value compares a measured value with the previously measured value. Confidence intervals were not taken into account in determining the direction of the comparison.
Trend
This comparison measures the indicator’s values over multiple time periods.<br>The Mann-Kendall Test for Statistical Significance is used to evaluate the trend<br>over 4 to 10 periods of measure, subject to data availability and comparability.
County: Washtenaw
Health / Tobacco Use
Value
Compared to:
County: Washtenaw Teens who Smoke: 9th, 11th Graders
County: Washtenaw Teens who Smoke: 9th, 11th Graders
1.0%
(2022)
Compared to:
MI Value
(4.5% in 2020)
The regional value is compared to the 2019 Michigan state value for 9th - 12th graders.
Prior Value
(2.6%)
Prior Value compares a measured value with the previously measured value. Confidence intervals were not taken into account in determining the direction of the comparison.
Trend
This comparison measures the indicator’s values over multiple time periods.<br>The Mann-Kendall Test for Statistical Significance is used to evaluate the trend<br>over 4 to 10 periods of measure, subject to data availability and comparability.
County: Washtenaw Teens who Used E-cigarettes: 9th, 11th Graders
County: Washtenaw Teens who Used E-cigarettes: 9th, 11th Graders
9.4%
(2022)
Compared to:
MI Value
(20.8% in 2020)
The regional value is compared to the 2019 Michigan state value for 9th - 12th graders.
Prior Value
(15.5%)
Prior Value compares a measured value with the previously measured value. Confidence intervals were not taken into account in determining the direction of the comparison.
Trend
This comparison measures the indicator’s values over multiple time periods.<br>The Mann-Kendall Test for Statistical Significance is used to evaluate the trend<br>over 4 to 10 periods of measure, subject to data availability and comparability.
County: Washtenaw
Health / Weight Status
Value
Compared to:
County: Washtenaw Children Who Are Obese
County: Washtenaw Children Who Are Obese
11.8%
% of children ages 2-17 yrs
(2017)
Compared to:
Prior Value
(11.4%)
Prior Value compares a measured value with the previously measured value. Confidence intervals were not taken into account in determining the direction of the comparison.
Trend
This comparison measures the indicator’s values over multiple time periods.<br>The Mann-Kendall Test for Statistical Significance is used to evaluate the trend<br>over 4 to 10 periods of measure, subject to data availability and comparability.
HP 2020 Target
(14.5%)
HP 2030 Target
(15.5%)
<div>The national Healthy People 2030 target is for children and adolescents aged 2-19 years. </div>
County: Washtenaw Teens who are Obese: 9th, 11th Graders
County: Washtenaw Teens who are Obese: 9th, 11th Graders
9.4%
(2022)
Compared to:
MI Value
(15.3% in 2020)
The regional value is compared to the 2019 Michigan state value for 9th - 12th graders.
Prior Value
(10.9%)
Prior Value compares a measured value with the previously measured value. Confidence intervals were not taken into account in determining the direction of the comparison.
Trend
This comparison measures the indicator’s values over multiple time periods.<br>The Mann-Kendall Test for Statistical Significance is used to evaluate the trend<br>over 4 to 10 periods of measure, subject to data availability and comparability.
County: Washtenaw
Community / Demographics
Value
Compared to:
County: Washtenaw Foreign Born Persons
County: Washtenaw Foreign Born Persons
12.4%
(2018-2022)
Compared to:
MI Value
(6.9%)
The regional value is compared to the Michigan State value.
US Value
(13.7%)
The regional value is compared to the national value.
Trend
This comparison measures the indicator’s values over multiple time periods.<br>The Mann-Kendall Test for Statistical Significance is used to evaluate the trend<br>over 4 to 10 periods of measure, subject to data availability and comparability.
County: Washtenaw Veteran Population
County: Washtenaw Veteran Population
4.3%
(2018-2022)
Compared to:
MI Value
(6.3%)
The regional value is compared to the Michigan State value.
US Value
(6.6%)
The regional value is compared to the national value.
Trend
This comparison measures the indicator’s values over multiple time periods.<br>The Mann-Kendall Test for Statistical Significance is used to evaluate the trend<br>over 4 to 10 periods of measure, subject to data availability and comparability.
County: Washtenaw
Community / Social Environment
Value
Compared to:
51.4%
(2022)
Compared to:
Prior Value
(57.0%)
Prior Value compares a measured value with the previously measured value. Confidence intervals were not taken into account in determining the direction of the comparison.
Trend
This comparison measures the indicator’s values over multiple time periods.<br>The Mann-Kendall Test for Statistical Significance is used to evaluate the trend<br>over 4 to 10 periods of measure, subject to data availability and comparability.
61.3%
(2022)
Compared to:
Prior Value
(65.9%)
Prior Value compares a measured value with the previously measured value. Confidence intervals were not taken into account in determining the direction of the comparison.
Trend
This comparison measures the indicator’s values over multiple time periods.<br>The Mann-Kendall Test for Statistical Significance is used to evaluate the trend<br>over 4 to 10 periods of measure, subject to data availability and comparability.
51.8%
(2022)
Compared to:
Prior Value
(53.1%)
Prior Value compares a measured value with the previously measured value. Confidence intervals were not taken into account in determining the direction of the comparison.
Trend
This comparison measures the indicator’s values over multiple time periods.<br>The Mann-Kendall Test for Statistical Significance is used to evaluate the trend<br>over 4 to 10 periods of measure, subject to data availability and comparability.
County: Washtenaw
Community / Transportation
Value
Compared to:
County: Washtenaw Households without a Vehicle
County: Washtenaw Households without a Vehicle
8.1%
(2018-2022)
Compared to:
MI Counties
The distribution is based on data from 83 Michigan counties.
U.S. Counties
The distribution is based on data from 3,133 U.S. counties and county equivalents.
MI Value
(7.2%)
The regional value is compared to the Michigan State value.
US Value
(8.3%)
The regional value is compared to the national value.
Trend
This comparison measures the indicator’s values over multiple time periods.<br>The Mann-Kendall Test for Statistical Significance is used to evaluate the trend<br>over 4 to 10 periods of measure, subject to data availability and comparability.
County: Washtenaw Mean Travel Time to Work
County: Washtenaw Mean Travel Time to Work
23.6
Minutes
(2018-2022)
Compared to:
MI Counties
The distribution is based on data from 83 Michigan counties.
U.S. Counties
The distribution is based on data from 3,131 U.S. counties and county equivalents.
MI Value
(24.5)
The regional value is compared to the Michigan State value.
US Value
(26.7)
The regional value is compared to the national value.
Trend
This comparison measures the indicator’s values over multiple time periods.<br>The Mann-Kendall Test for Statistical Significance is used to evaluate the trend<br>over 4 to 10 periods of measure, subject to data availability and comparability.
County: Washtenaw Workers Commuting by Public Transportation
County: Washtenaw Workers Commuting by Public Transportation
3.9%
(2018-2022)
Compared to:
MI Counties
The distribution is based on data from 83 Michigan counties.
U.S. Counties
(2015-2019)
The distribution is based on data from 3,142 U.S. counties and county equivalents.
MI Value
(1.1%)
The regional value is compared to the Michigan State value.
US Value
(3.8%)
The regional value is compared to the national value.
Trend
This comparison measures the indicator’s values over multiple time periods.<br>The Mann-Kendall Test for Statistical Significance is used to evaluate the trend<br>over 4 to 10 periods of measure, subject to data availability and comparability.
HP 2030 Target
(5.3%)
County: Washtenaw Workers who Drive Alone to Work
County: Washtenaw Workers who Drive Alone to Work
63.4%
(2018-2022)
Compared to:
MI Counties
The distribution is based on data from 83 Michigan counties.
U.S. Counties
The distribution is based on data from 3,133 U.S. counties and county equivalents.
MI Value
(77.1%)
The regional value is compared to the Michigan State value.
US Value
(71.7%)
The regional value is compared to the national value.
Trend
This comparison measures the indicator’s values over multiple time periods.<br>The Mann-Kendall Test for Statistical Significance is used to evaluate the trend<br>over 4 to 10 periods of measure, subject to data availability and comparability.
County: Washtenaw
Economy / Food Insecurity
Value
Compared to:
County: Washtenaw Adults in Family Reduced Food Intake Due to Cost
County: Washtenaw Adults in Family Reduced Food Intake Due to Cost
7.2%
% of adults in family
(2015)
Compared to:
Prior Value
(5.3%)
Prior Value compares a measured value with the previously measured value. Confidence intervals were not taken into account in determining the direction of the comparison.
County: Washtenaw
Economy / Housing & Homes
Value
Compared to:
County: Washtenaw Overcrowded Households
County: Washtenaw Overcrowded Households
1.4%
(2018-2022)
Compared to:
MI Counties
The distribution is based on data from 83 Michigan counties.
MI Value
(1.6%)
The regional value is compared to the Michigan State value.
US Value
(3.4%)
The regional value is compared to the national value.
Trend
This comparison measures the indicator’s values over multiple time periods.<br>The Mann-Kendall Test for Statistical Significance is used to evaluate the trend<br>over 4 to 10 periods of measure, subject to data availability and comparability.
County: Washtenaw Renters Spending 30% or More of Household Income on Rent
County: Washtenaw Renters Spending 30% or More of Household Income on Rent
53.0%
(2018-2022)
Compared to:
MI Counties
The distribution is based on data from 83 Michigan counties.
U.S. Counties
The distribution is based on data from 3,132 U.S. counties and county equivalents.
MI Value
(49.0%)
The regional value is compared to the Michigan State value.
US Value
(49.9%)
The regional value is compared to the national value.
Trend
This comparison measures the indicator’s values over multiple time periods.<br>The Mann-Kendall Test for Statistical Significance is used to evaluate the trend<br>over 4 to 10 periods of measure, subject to data availability and comparability.
HP 2030 Target
(25.5%)
County: Washtenaw
Economy / Income
Value
Compared to:
County: Washtenaw Median Household Income
County: Washtenaw Median Household Income
$84,245
(2018-2022)
Compared to:
MI Counties
The distribution is based on data from 83 Michigan counties.
U.S. Counties
The distribution is based on data from 3,132 U.S. counties and county equivalents.
MI Value
($68,505)
The regional value is compared to the Michigan State value.
US Value
($75,149)
The regional value is compared to the national value.
Trend
This comparison measures the indicator’s values over multiple time periods.<br>The Mann-Kendall Test for Statistical Significance is used to evaluate the trend<br>over 4 to 10 periods of measure, subject to data availability and comparability.
County: Washtenaw Per Capita Income
County: Washtenaw Per Capita Income
$49,568
(2018-2022)
Compared to:
MI Counties
The distribution is based on data from 83 Michigan counties.
U.S. Counties
The distribution is based on data from 3,133 U.S. counties and county equivalents.
MI Value
($37,929)
The regional value is compared to the Michigan State value.
US Value
($41,261)
The regional value is compared to the national value.
Trend
This comparison measures the indicator’s values over multiple time periods.<br>The Mann-Kendall Test for Statistical Significance is used to evaluate the trend<br>over 4 to 10 periods of measure, subject to data availability and comparability.
County: Washtenaw
Economy / Poverty
Value
Compared to:
County: Washtenaw Children Living Below Poverty Level
County: Washtenaw Children Living Below Poverty Level
11.4%
(2018-2022)
Compared to:
MI Counties
The distribution is based on data from 83 Michigan counties.
U.S. Counties
The distribution is based on data from 3,132 U.S. counties and county equivalents.
MI Value
(17.8%)
The regional value is compared to the Michigan State value.
US Value
(16.7%)
The regional value is compared to the national value.
Trend
This comparison measures the indicator’s values over multiple time periods.<br>The Mann-Kendall Test for Statistical Significance is used to evaluate the trend<br>over 4 to 10 periods of measure, subject to data availability and comparability.
County: Washtenaw Families Living Below Poverty Level
County: Washtenaw Families Living Below Poverty Level
6.2%
(2018-2022)
Compared to:
MI Counties
The distribution is based on data from 83 Michigan counties.
U.S. Counties
The distribution is based on data from 3,104 U.S. counties and county equivalents.
MI Value
(8.8%)
The regional value is compared to the Michigan State value.
US Value
(8.8%)
The regional value is compared to the national value.
Trend
This comparison measures the indicator’s values over multiple time periods.<br>The Mann-Kendall Test for Statistical Significance is used to evaluate the trend<br>over 4 to 10 periods of measure, subject to data availability and comparability.
County: Washtenaw Households with Children
County: Washtenaw Households with Children
36,610
Households
(2022)
Compared to:
Prior Value
(36,961)
Prior Value compares a measured value with the previously measured value. Confidence intervals were taken into account in determining the direction of the comparison.
County: Washtenaw People 65+ Living Below Poverty Level
County: Washtenaw People 65+ Living Below Poverty Level
6.2%
(2018-2022)
Compared to:
MI Counties
The distribution is based on data from 83 Michigan counties.
U.S. Counties
The distribution is based on data from 3,133 U.S. counties and county equivalents.
MI Value
(9.0%)
The regional value is compared to the Michigan State value.
US Value
(10.0%)
The regional value is compared to the national value.
Trend
This comparison measures the indicator’s values over multiple time periods.<br>The Mann-Kendall Test for Statistical Significance is used to evaluate the trend<br>over 4 to 10 periods of measure, subject to data availability and comparability.
County: Washtenaw People 65+ Living Below Poverty Level (Count)
County: Washtenaw People 65+ Living Below Poverty Level (Count)
3,305
People
(2018-2022)
Compared to:
Trend
This comparison measures the indicator’s values over multiple time periods.<br>The Mann-Kendall Test for Statistical Significance is used to evaluate the trend<br>over 4 to 10 periods of measure, subject to data availability and comparability.
County: Washtenaw People Living Below Poverty Level
County: Washtenaw People Living Below Poverty Level
13.8%
(2018-2022)
Compared to:
MI Counties
The distribution is based on data from 83 Michigan counties.
U.S. Counties
The distribution is based on data from 3,133 U.S. counties and county equivalents.
MI Value
(13.1%)
The regional value is compared to the Michigan State value.
US Value
(12.5%)
The regional value is compared to the national value.
Trend
This comparison measures the indicator’s values over multiple time periods.<br>The Mann-Kendall Test for Statistical Significance is used to evaluate the trend<br>over 4 to 10 periods of measure, subject to data availability and comparability.
HP 2030 Target
(8.0%)
County: Washtenaw Young Children Living Below Poverty Level
County: Washtenaw Young Children Living Below Poverty Level
11.8%
(2018-2022)
Compared to:
MI Counties
The distribution is based on data from 83 Michigan counties.
U.S. Counties
The distribution is based on data from 3,131 U.S. counties and county equivalents.
MI Value
(20.1%)
The regional value is compared to the Michigan State value.
US Value
(18.1%)
The regional value is compared to the national value.
Trend
This comparison measures the indicator’s values over multiple time periods.<br>The Mann-Kendall Test for Statistical Significance is used to evaluate the trend<br>over 4 to 10 periods of measure, subject to data availability and comparability.
County: Washtenaw Youth not in School or Working
County: Washtenaw Youth not in School or Working
1.2%
(2018-2022)
Compared to:
MI Counties
The distribution is based on data from 83 Michigan counties.
U.S. Counties
The distribution is based on data from 3,130 U.S. counties and county equivalents.
MI Value
(2.0%)
The regional value is compared to the Michigan State value.
US Value
(1.8%)
The regional value is compared to the national value.
Trend
This comparison measures the indicator’s values over multiple time periods.<br>The Mann-Kendall Test for Statistical Significance is used to evaluate the trend<br>over 4 to 10 periods of measure, subject to data availability and comparability.
County: Washtenaw
Education / Educational Attainment
Value
Compared to:
County: Washtenaw People 25+ with a Bachelor's Degree or Higher
County: Washtenaw People 25+ with a Bachelor's Degree or Higher
57.4%
(2018-2022)
Compared to:
MI Counties
The distribution is based on data from 83 Michigan counties.
U.S. Counties
The distribution is based on data from 3,133 U.S. counties and county equivalents.
MI Value
(31.1%)
The regional value is compared to the Michigan State value.
US Value
(34.3%)
The regional value is compared to the national value.
Trend
This comparison measures the indicator’s values over multiple time periods.<br>The Mann-Kendall Test for Statistical Significance is used to evaluate the trend<br>over 4 to 10 periods of measure, subject to data availability and comparability.
County: Washtenaw People 25+ with a High School Diploma or Higher
County: Washtenaw People 25+ with a High School Diploma or Higher
95.8%
(2018-2022)
Compared to:
MI Counties
The distribution is based on data from 83 Michigan counties.
U.S. Counties
The distribution is based on data from 3,133 U.S. counties and county equivalents.
MI Value
(91.8%)
The regional value is compared to the Michigan State value.
US Value
(89.1%)
The regional value is compared to the national value.
Trend
This comparison measures the indicator’s values over multiple time periods.<br>The Mann-Kendall Test for Statistical Significance is used to evaluate the trend<br>over 4 to 10 periods of measure, subject to data availability and comparability.
County: Washtenaw
Environmental Health / Built Environment
Value
Compared to:
County: Washtenaw Access to Parks
County: Washtenaw Access to Parks
0.8%
(2020)
Compared to:

MI Counties
The distribution is based on data from 83 Michigan counties.
MI Value
(59.6%)
The regional value is compared to the Michigan State value.
Prior Value
(0.5%)
Prior Value compares a measured value with the previously measured value. Confidence intervals were not taken into account in determining the direction of the comparison.
